How to understand the Super-K event display
Here is an example of an electron-like neutrino “event” (interaction) in the Super-K water Cherenkov detector:
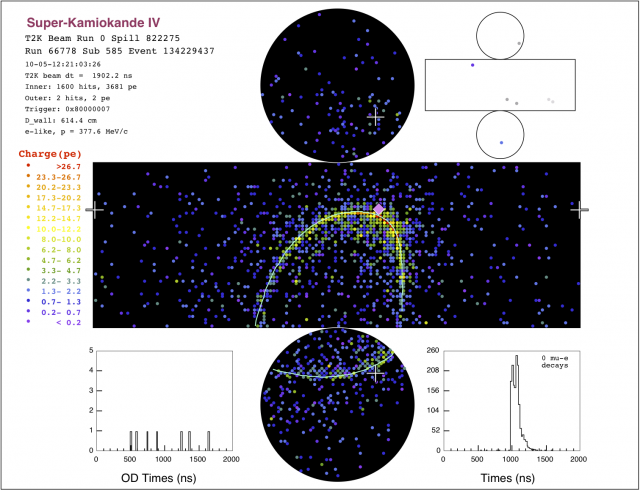
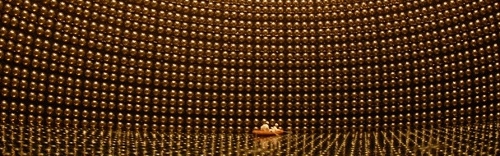
The Super-K detector is lined with over 11,000 phototubes, each 50cm in diameter. The event display is a map of the inner detector phototube array, showing the intensity of light received by each tube in any given event.
Imagine a tin can, with its top and bottom lids cut off and bent back, and its barrel slit and folded flat: that is how the event display is presented. Each dot is one phototube, and its color represents the relative amount of light it collected, in terms of the amount of electric charge produced by the phototube, during the 1.3 microsecond time window in which the displayed data were logged. The smaller map at upper right shows a similar map of the outer detector, which has only about 1800 phototubes.
If the info at upper left says the run is “normal” then data taking is underway; sometimes you may see “calibration” or “test”, meaning physicists are working on the detector or its data acquisition electronics.
In the example above, the electron produced by an electron neutrino scatters in the water, producing a fuzzy ring of Cherenkov light. The location and shape of the ring tell us the direction of the electron. The direction of the electron is very close to the direction of the incoming neutrino that produced it. (If the ring were sharp-edged, the event would be identified as “muon-like”). A computer algorithm rates each event as e-like or muon-like — some events are ambiguous and may have to be checked by a physicist.
An “event” is recorded whenever a significant amount of activity is observed in the phototubes within a brief time window. All phototube data are logged for later analysis. The Super-K detector is equipped with sophisticated electronics to acquire data without any “dead time” after an event is recorded, so rapid sequences of events can be logged. Offline (minutes or hours later) computer algorithms check the event data to see if the pattern of light observed corresponds to a neutrino interaction.
Most of the events recorded are not due to neutrinos, but to downward-going muon particles that were not stopped by the 1000 meter thickness of rock overhead. These muons are of some interest too, since they were created along with neutrinos by the decay of pions and other short-lived subatomic particles in the upper atmosphere, and they allow us to continuously check the health of the detector.
The public version of the real-time event display does not show every event that is recorded at Super-K, but only a random sample every few seconds. Physicists on duty at Super-K to babysit the experiment can switch to another map version, which shows the relative time of arrival of the light signals. Also, only a few hundred out of the millions of events recorded at Super-K each year will be due to neutrinos that came from J-PARC. There is no way to identify beam neutrinos immediately; the data have to be carefully analyzed, later, to determine whether a particular event arrived during the very tiny time window when beam neutrinos passed through Super-K (half a microsecond, about once every three seconds, when the J-PARC beam is operating).